Charts: FNI

FNI has been requested by one of the members in one group in Facebook for me to cover, so here's my brief analysis with regards to FNI.

FNI is still in a tight range for now, and considering the regulatory views of miners in the Philippines due to the strict implementation of DENR led by Gina Lopez, you should watchout carefully how the trade unfolds.

Figure 1: FNI Parameters
As far as my memory serves, this is one of the hyped stocks few years ago, were many investors are left crying with losses up to 100%. The key level to break for FNI is at 0.86 ~ 0.88 with big volume. Last Friday's close generated a volume buzz on my watchlist, and three (3) crossover signals which can be issued as a buy signal. Be cautious though as this is an exotic stock, and is mostly played in the market.

If you are a trend follower, please avoid this stock. For a momentum perspective, avoid this stock also. Watchout for volume buzzes so you can spot on potential returns on this stock.

Figure 2: FNI Ichimoku

Stock name FNI
Current Price 0.86
YTD Return 24.64%
52Wk High 1.34
52Wk Low 0.46
MVWAP (10 days) 0.84
MVWAP (20 days) 0.84
MVWAP (65 days) 0.86
MVWAP (252 days) 0.87
YTD Flow 583,543,360.00
20D Ave Volume 10,481,300
50D Ave Volume 17,232,140
90D Ave Volume 33,159,256

CAVEAT!

Disclaimer: Trading is a risky thing and the post in this site are for educational purposes only. Equities and Forex Trading is speculative in nature and may harm every trader and investor by losing money. Thus, do not treat this post as a recommendation to BUY or SELL a stock or a currency pair. Blog contents are valid only on the date of publication and will be subject to change without notice. Thus, the reader is advised to take precaution, and is recommended to do their own studies before pressing the BUY and SELL buttons. I will not take any responsibility with the readers trading results.

Charts: MEGanon?

Well, I have been trading $MEG before, though from my experience it is quite well correlated with the Philippine Composite Index, thus sometimes I tend to look at PSEi first, to see its support and resistance, before I look at highly correlated stocks like MEG.

Figure 1: MEG Yearly Chart
If we look at the yearly chart of MEG, it is a buy on dips, with immediate line in sand at Php4.25, or the year should close above Php4.25 in order to have a shot at trading high next year.


Figure 2: Spyfrat Chart
Looking at RSI (30), there's a current resistance shown in Figure 2, with a  resistance also of 50SMA, so if you think it will stop for a while on those resistances, calculate risk reward before opting to trade the stock.

Figure 3: Support and Resistances
Looking at the parameters, if you want to trade the stock come Monday, line in sand at Php4.49 with the expectation that it would break above Php5.5, as I see that the stock is bullish at this point with a series of structure highs. This would I think give you a better risk reward.


Stock name MEG
Current Price 4.79
YTD Return 12.71%
52Wk High 5.51
52Wk Low 3
MVWAP (10 days) 4.62
MVWAP (20 days) 4.7
MVWAP (65 days) 4.87
MVWAP (252 days) 4.28
YTD Flow -717,022,336.00
20D Ave Volume 45,948,048
50D Ave Volume 43,508,164
90D Ave Volume 45,909,256

CAVEAT!

Disclaimer: Trading is a risky thing and the post in this site are for educational purposes only. Equities and Forex Trading is speculative in nature and may harm every trader and investor by losing money. Thus, do not treat this post as a recommendation to BUY or SELL a stock or a currency pair. Blog contents are valid only on the date of publication and will be subject to change without notice. Thus, the reader is advised to take precaution, and is recommended to do their own studies before pressing the BUY and SELL buttons. I will not take any responsibility with the readers trading results.

Scatter-plots: The Leaders and Laggards

You might already have known about scatter-plots before, it is usually used by groups and traders such as BOH of Jiego, and The Dividend Observer. So basically, mine is just a replicate of that system, but I don't know how they use it, or if there are other systems they coupled with it, but for me I just used it to generate or filter stocks which are kind of an outlier. And from that, I look at the charts, look at statistics and do trade planning. This is one way of filtering stocks so you won't have to look at every stock of PSE.

Figure 1: Scatterplots
Basically, from this data, I would try to find the outlier, which in Figure 1 (which shows the 3months versus Year-to-Date returns of the index stocks), I would like to look at SMC, PCOR, ICT, EDC, TEL, EMP, DMC or SCC. With that list, instead of looking at 30 stocks, I would have to look at only a few of them. But do take note that the timeframe for these one would depend on the timeframe of your returns plotted, meaning, since the figure is pointing out a 3MO Vs YTD Return, then your timeframe should also be medium term to long term.

Let me know if you need copies of this so I can plan how I would share it to everyone.


Charts: SPX500 Warning!

Many investors in the Philippines correlates indices from other countries, and one index that investors watch for sentiment is the SPX500. SPX500 is S&P 500 Index of US listed shares.

I have been quite cautious and have watched how this index would unfold, since I am thinking that momentum has slowed down.

Figure 1: SPX500 Chart
Though it broke above 2,100++ levels, and currently held it, if momentum doesn't build up, this is going to be quite bearish. Though FED has not raised interest rates this September, I am still observing this as I think this could be the last leg up for SPX500. Fibonacci Extensions are shown below for price projection and target. Watchout for 2300-2400 levels.

Figure 2: Fib Extensions


CAVEAT!

Disclaimer: Trading is a risky thing and the post in this site are for educational purposes only. Equities and Forex Trading is speculative in nature and may harm every trader and investor by losing money. Thus, do not treat this post as a recommendation to BUY or SELL a stock or a currency pair. Blog contents are valid only on the date of publication and will be subject to change without notice. Thus, the reader is advised to take precaution, and is recommended to do their own studies before pressing the BUY and SELL buttons. I will not take any responsibility with the readers trading results.

Charts: FLI high!

$FLI (Filinvest Land, Inc) is one of my favorite stocks in PSE, though as of the moment, I have no shares with FLI. I missed the buy level last September 9, 2016, which would have produced me close to 10% by now.

Figure 1: FLI Levels
FLI needs to punch through midpoint at Php1.95 to avoid a potential lower high, which as you know is a bearish indication which would mean that momentum has slowed down. Buy levels at Php1.81 - Php1.86, though you can buy on the levels posted, just make sure to calculate risk vs reward ratio before buying. A risk reward ratio of 3 is pretty good enough.

Figure 2: Bearish Butterfly on the Monthly
On harmonics perspective, I am looking at this potential butterfly setup on the monthly chart, with target prices as shown on the image. I will be bearish with the stock if it breaks below Php1.80.

On a side note, those who have been using Jared's SWAG and Mark Anthony's crossover system, they have issued a BUY signal. Volume is quite good also with statistics as shown below.

Stock name FLI
Current Price 1.91
YTD Return 5.52%
52Wk High 2.08
52Wk Low 1.32
MVWAP (10 days) 1.86
MVWAP (20 days) 1.88
MVWAP (65 days) 1.94
MVWAP (252 days) 1.79
YTD Flow -139,602,848.00
20D Ave Volume 10,836,850
50D Ave Volume 18,999,220
90D Ave Volume 18,576,678

CAVEAT!

Disclaimer: Trading is a risky thing and the post in this site are for educational purposes only. Equities and Forex Trading is speculative in nature and may harm every trader and investor by losing money. Thus, do not treat this post as a recommendation to BUY or SELL a stock or a currency pair. Blog contents are valid only on the date of publication and will be subject to change without notice. Thus, the reader is advised to take precaution, and is recommended to do their own studies before pressing the BUY and SELL buttons. I will not take any responsibility with the readers trading results.

Charts: CHIB

$CHIB has been one of the low volatility stocks that you would want to have (10 day Volatility at 4.08%) though it has only been up 1.88% year-to-date. But here's some brief analysis with the stock.

Figure 1: CHIB
$CHIB is currently below 50SMA, but I found an RSI support at 45 level. This may provide a little bit of a bounce.

Figure 2: Foreign Flows
In Foreign flow perspective, it has a net inflow of around Php58M, which is pretty good compared to other stocks. But take note that CHIB is in a narrow range as of the moment, so it needs to take out Php39.5 definitively in order to widen its range.

Figure 3: Range Parameters for CHIB
If I would have to trade it, I would buy it at market price tomorrow (Php37.9) with a stop at Php37.1 and target above Php39.5. That would give me a decent Risk Reward Ratio of 2. Though multiple MVWAP resistance are waiting at around Php38 level.

Statistics are shown below:


Stock name CHIB
Current Price 37.9
YTD Return 1.88%
52Wk High 43
52Wk Low 33.5
MVWAP (10 days) 38.06
MVWAP (20 days) 38.12
MVWAP (65 days) 38.11
MVWAP (252 days) 38.44
YTD Flow 57,823,264.00
20D Ave Volume 83,000
50D Ave Volume 101,066
90D Ave Volume 96,414

CAVEAT!

Disclaimer: Trading is a risky thing and the post in this site are for educational purposes only. Equities and Forex Trading is speculative in nature and may harm every trader and investor by losing money. Thus, do not treat this post as a recommendation to BUY or SELL a stock or a currency pair. Blog contents are valid only on the date of publication and will be subject to change without notice. Thus, the reader is advised to take precaution, and is recommended to do their own studies before pressing the BUY and SELL buttons. I will not take any responsibility with the readers trading results.

Charts: EURUSD

One of the currency pairs that is mostly traded in Forex is the EURUSD. As I have said before, when I trade with Forex, I usually use Harmonics and Structural Trading, as I am more confident with my trades. Quite different with how I trade my stocks though, but still I get to have high probability trades and risk management.

Figure 1: EURUSD Chart
The chart is a BAT pattern, and it is quite a good pattern to trade as per my experience. Potential Reversal Zone is at 0.866 retracement of the XA leg. You can go long there and put a stop below 100% retracement. Though I do not trade it like this, as I always use to find confluence with Fibonacci's and structures, it is a great start for you to learn more about harmonics.

Also, for your information, I am using FXCM's Tradestation, but I like to draw in tradingview when it comes to harmonics.

CAVEAT!


Disclaimer: Trading is a risky thing and the post in this site are for educational purposes only. Equities and Forex Trading is speculative in nature and may harm every trader and investor by losing money. Thus, do not treat this post as a recommendation to BUY or SELL a stock or a currency pair. Blog contents are valid only on the date of publication and will be subject to change without notice. Thus, the reader is advised to take precaution, and is recommended to do their own studies before pressing the BUY and SELL buttons. I will not take any responsibility with the readers trading results.


Charts: DNL - The hottest stock, before.

One of the filters I used when screening stocks is the SWAG system by Jared Odulio. This has been proven to provide gains to traders, though for me I think it will not stand the test of time if its a stand alone system. As usual, I pair it with my range parameters and other systems to provide me with high probability trades.

Figure 1: DNL Swag
When I was scanning my filters, this stock came out and I had to look at the charts if I could enter on this one. Last Friday's close had the 13EMA (Exponential Moving Average) crossed the 20SMA (Simple Moving Average).

Figure 2: DNL Parameters
Current parameters is showing that it is on the top end of my range, which I think needs close monitoring. If one would be long on this stock, put a stop around Php11.40 with a target measured move of around Php16.40.

Figure 3: Foreign flows
Statistics are shown below:


Stock name DNL
Current Price 11.8
YTD Return 28.96%
52Wk High 11.8
52Wk Low 6.77
MVWAP (10 days) 11.18
MVWAP (20 days) 11.17
MVWAP (65 days) 10.48
MVWAP (252 days) 9.39
YTD Flow 928,395,840.00
20D Ave Volume 5,489,975
50D Ave Volume 6,079,750
90D Ave Volume 5,209,438

CAVEAT!

Disclaimer: Trading is a risky thing and the post in this site are for educational purposes only. Equities and Forex Trading is speculative in nature and may harm every trader and investor by losing money. Thus, do not treat this post as a recommendation to BUY or SELL a stock or a currency pair. Blog contents are valid only on the date of publication and will be subject to change without notice. Thus, the reader is advised to take precaution, and is recommended to do their own studies before pressing the BUY and SELL buttons. I will not take any responsibility with the readers trading results.


Update: Xurpas

If you see on the subject line the word "Update", expect that it will just be a short post as it would only contain (just as you were thinking) updates from previous post I have.

This time, let us look at the update from $X stock (Xurpas) which we had a post previously HERE.

Figure 1: X Chart Update
$X bounced off near support ad Php13.28 and is currently our Potential Reversal Zone. Though we could see some rejections of price at Php14.00, I would like you to look closely on this one and execute your trades with better risk-reward. Look out for buy signals on the lower time frame. Line in sand is still at around Php11.00.

Disclaimer: Trading is a risky thing and the post in this site are for educational purposes only. Equities and Forex Trading is speculative in nature and may harm every trader and investor by losing money. Thus, do not treat this post as a recommendation to BUY or SELL a stock or a currency pair. Blog contents are valid only on the date of publication and will be subject to change without notice. Thus, the reader is advised to take precaution, and is recommended to do their own studies before pressing the BUY and SELL buttons. I will not take any responsibility with the readers trading results.

Value Health over Money!

People always want to work so hard for their family's needs and tend to forget that resting a little bit, having a vacation, to being happy always is quite essential for every human being especially to those who are in the corporate world. This is one of my realizations for the past few weeks as I have been putting all my energy into work, even on weekends, and forget that I need to relax a bit, release of some steam, pray to God, and be happy. I have been quite out on stocks for more than a week now, and that I feel blessed that I am still able to share with you guys my knowledge about stock and forex trading.

I would suggest that you make time for vacations, sports, as these will help you think more clearly, have better retention over things, and peace of mind. Go out with your friends (though I am an introvert and would most likely would want to be at home), play video games, drink beer moderately, etc. Life is better when you do that, and would be more happier if you have God with you.

Though I am quite sensitive when it comes to writing a post with religion, since I know that not all of us here in the Philippines are Christians. Just focus on my trading strategies so you will learn a lot from it.

And since this will just be a short post, I am living you an update on the USOIL chart posted here.

Figure 1: USOIL Chart

Disclaimer: Trading is a risky thing and the post in this site are for educational purposes only. Equities and Forex Trading is speculative in nature and may harm every trader and investor by losing money. Thus, do not treat this post as a recommendation to BUY or SELL a stock or a currency pair. Blog contents are valid only on the date of publication and will be subject to change without notice. Thus, the reader is advised to take precaution, and is recommended to do their own studies before pressing the BUY and SELL buttons. I will not take any responsibility with the readers trading results.

Charts: Nagmahal, Nasaktan, Nag-$X

On a year to date basis, $X is down by 0.39%, which it needs to take back Php15.22 before the year ends, in order to have a good run by next year. If you look at the trendline on the figure below, it has been broken (though sometimes drawing this trend-lines are quite subjective).

Figure 1: X Daily Chart
The trade last Friday was down, having a max volume in ten (10) days, which would sometimes signal that the selling pressure might be exhausted, thus a signal to watch the stock closely and maybe up for a bounce.

Figure 2: $X Parameters
Parameters for Support and Resistance are shown above, with a potential bullish Gartley forming and the Potential Reversal Zone is around Php13.20. Statistics shown below for reference.

Stock name X
Current Price 15.16
YTD Return -0.39%
52Wk High 20
52Wk Low 10.5
MVWAP (10 days) 15.43
MVWAP (20 days) 15.94
MVWAP (65 days) 16.53
MVWAP (252 days) 16.01
YTD Flow 212,786,368.00
20D Ave Volume 1,279,720
50D Ave Volume 1,588,576
90D Ave Volume 2,060,521


CAVEAT!

Disclaimer: Trading is a risky thing and the post in this site are for educational purposes only. Equities and Forex Trading is speculative in nature and may harm every trader and investor by losing money. Thus, do not treat this post as a recommendation to BUY or SELL a stock or a currency pair. Blog contents are valid only on the date of publication and will be subject to change without notice. Thus, the reader is advised to take precaution, and is recommended to do their own studies before pressing the BUY and SELL buttons. I will not take any responsibility with the readers trading results.

Charts: USOIL

I have quite a few friends who have been looking at global oil prices regularly, as they are working in an Oil and Gas firm, and that their jobs are not secured as of the moment due to having no projects caused by low oil price.

I have this pattern for $USOIL which formed a bullish Gartley with Potential Reversal Zone (PRZ) at around $41.50. My strategy for this kind of trade is to wait for a bounce to .236 and place an aggressive C, meaning I have to short this one until it reaches its potential reversal zone. If you look at the price action, its a good way to short, right?

Figure 1: USOIL Chart
Until then, oil price would be quite low and be bad for those working in firms dependent on the price of oil. I don't expect also for oil price to go high above $50.00 for the time being, but since we are traders, we trade what is available in the market.

CAVEAT!

Disclaimer: Trading is a risky thing and the post in this site are for educational purposes only. Equities and Forex Trading is speculative in nature and may harm every trader and investor by losing money. Thus, do not treat this post as a recommendation to BUY or SELL a stock or a currency pair. Blog contents are valid only on the date of publication and will be subject to change without notice. Thus, the reader is advised to take precaution, and is recommended to do their own studies before pressing the BUY and SELL buttons. I will not take any responsibility with the readers trading results.

Charts: Posting about PXP

If you are a price action trader, one stock that you would disregards is $PXP. This stock has been battered and been sold out in the past months. But the question lies with, is $PXP now oversold?

Figure 1: PXP Daily Chart
Looking at the chart, the range of Php3.125 and Php 2.34375 are my buy levels, that means that the stock my be oversold and would have a technical bounce soon. But if you look at current price action, I would wait some confirmation, or signs of reversal before I place my bet. Line in sad is Php2.34375.

Figure 2: Fibonacci Lines and Extensions
Strong areas of support if you are using Fibonacci are on the range of Php2.45-Php2.90. Watchout for this stock as this might be tradeable again. Statistics are shown below for reference.


Stock name PXP
Current Price 3.05
YTD Return 134.62%
52Wk High 5.7
52Wk Low 1.16
MVWAP (10 days) 3.3
MVWAP (20 days) 3.6
MVWAP (65 days) 4.49
MVWAP (252 days) 3.42
YTD Flow -49,147,424.00
20D Ave Volume 2,941,650
50D Ave Volume 7,154,372
90D Ave Volume 7,640,495

CAVEAT!

Disclaimer: Trading is a risky thing and the post in this site are for educational purposes only. Equities and Forex Trading is speculative in nature and may harm every trader and investor by losing money. Thus, do not treat this post as a recommendation to BUY or SELL a stock or a currency pair. Blog contents are valid only on the date of publication and will be subject to change without notice. Thus, the reader is advised to take precaution, and is recommended to do their own studies before pressing the BUY and SELL buttons. I will not take any responsibility with the readers trading results.

Charts: SECB

$SECB had a great run last Friday with 7.64% day change and quite a big volume, making it the current 52 Week High. Though it had a great run, foreigners were able to have a net selling of around 264M. The run is a continuation from a breakout that happened last Thursday with foreigners having a net buy of around 120M.

Figure 1: SECB Daily Chart
I am expecting SECB to have a pullback with low volume near Php225 to Php237.5 range before breaking the Php250 level going to Php275.00. This is the level I am going to watch as it is also the potential reversal zone of the Bearish Crab on the monthly chart.

Figure 2: Bearish Crab on the monthly
Statistics are shown below for reference.


Stock name SECB
Current Price 248
YTD Return 74.65%
52Wk High 248
52Wk Low 130.1
MVWAP (10 days) 223.11
MVWAP (20 days) 220.81
MVWAP (65 days) 210.5
MVWAP (252 days) 183.94
YTD Flow 2,348,961,280.00
20D Ave Volume 2,513,066
50D Ave Volume 1,894,370
90D Ave Volume 2,116,815


Disclaimer: Trading is a risky thing and the post in this site are for educational purposes only. Equities and Forex Trading is speculative in nature and may harm every trader and investor by losing money. Thus, do not treat this post as a recommendation to BUY or SELL a stock or a currency pair. Blog contents are valid only on the date of publication and will be subject to change without notice. Thus, the reader is advised to take precaution, and is recommended to do their own studies before pressing the BUY and SELL buttons. I will not take any responsibility with the readers trading results.

Filters: Inside BB Screener by Spyfrat

I introduced to all of you before about Amibroker, and since then I have been studying how to code AFL in order to automate some portion of my trading plan. One useful thing about Amibroker is its Exploration tool, where you can filter stocks, or any statistics, or information you need be tabulated by Amibroker.

As we all want high probability trades, I have thought of having to make filters just so I would know what stocks I should study first during night time, and one of my filter is the "Inside BB" strategy by the legendary Spyfrat. The list below contains the stocks which passed the filter and a brief analysis of that stock.

HOUSE

Figure 1: HOUSE Chart
 $HOUSE had a great run last Friday but with very low volume. Though the chart looks good as it created a higher low. I'm hoping it should be able to test Php8.60 area. The line in sand is at Php7.422, as that would mean a break in the structure low, which would create a lower high.

ATN

Figure 2: ATN Quarterly Chart
 This should be a buy on dips on the quarterly chart with line in sand at Php0.37 area.


EDC

For EDC, analysis has been posted here.

FNI

Figure 3: FNI
 Watch out on the Global Nickel price as this may affect FNI. And also Gina Lopez.
A break above Php0.86 definitively would be a good starting point for a run.

CAVEAT!


Disclaimer: Trading is a risky thing and the post in this site are for educational purposes only. Equities and Forex Trading is speculative in nature and may harm every trader and investor by losing money. Thus, do not treat this post as a recommendation to BUY or SELL a stock or a currency pair. Blog contents are valid only on the date of publication and will be subject to change without notice. Thus, the reader is advised to take precaution, and is recommended to do their own studies before pressing the BUY and SELL buttons. I will not take any responsibility with the readers trading results.


Charts: EDC, for the long term?

EDC has been one of my first stocks when I started investing a few years ago. I had a good run with it having bought at around Php5.00 and sold near its high of Php9++ with some guidance from my brother to sell it. Business wise, it is good for the long term with investments in renewable energy sources.

Now, as it is trading in a range for quite some time now, is it a good stock to buy? Let's see below.

Figure 1: EDC Weekly Chart
EDC is locked in a triangle, which I think is bearish if it materializes. If it breaks below Php5.20, then I would be very bearish on the stock. On a year-to-date perspective, you would have lost -6.54% based on Friday's close. Statistics are shown below.


Stock name EDC
Current Price 5.8
YTD Return -6.45%
52Wk High 7.02
52Wk Low 5.14
MVWAP (10 days) 5.8
MVWAP (20 days) 5.87
MVWAP (65 days) 5.73
MVWAP (252 days) 5.86
YTD Flow 292,386,784.00
20D Ave Volume 13,995,765
50D Ave Volume 15,476,720
90D Ave Volume 15,270,214

In a monthly perspective, I am hoping EDC would stay above Php5.00, as it has been staying for quite a few months. Hope because, I dont want it to slide down as it would really be bad for the stock. So far, that support line is holding and that, I don't want to see this SHARK.

Figure 2: Shark Pattern on the Monthly.
CAVEAT!

Disclaimer: Trading is a risky thing and the post in this site are for educational purposes only. Equities and Forex Trading is speculative in nature and may harm every trader and investor by losing money. Thus, do not treat this post as a recommendation to BUY or SELL a stock or a currency pair. Blog contents are valid only on the date of publication and will be subject to change without notice. Thus, the reader is advised to take precaution, and is recommended to do their own studies before pressing the BUY and SELL buttons. I will not take any responsibility with the readers trading results.

PSEi: Are we crashing?

Just a few days ago, one personality posted on Facebook the Philippine Stock Market crashing due to the drug war being a bad investment, and pointing out that the drug war led by the current administration is causing the PSEi to go down.

Figure 1: Facebook post.

While I would not agree with his post in many sense, I would not waste my time giving lectures to him, telling him to shut up and learn about the stock market, as we all know his personality so well. Instead, I'll have to use my time studying the market, reading news about the companies, check Foreign Exchange related news, etc.

Some people would say that its the news that makes the market, while others would say that its the market that makes the news. Both have its own point, but it doesn't matter. The point here is, you should always have a PLAN whatever you do, whatever company shares you buy, there should always be a plan, and it all starts in there.

IS THE PSEi CRASHING?

We had a good run since the start of the year, with 9.06% year-to-date return. Currently, we are near crucial support at around 7500. Year-to-date flows is only around 37.6M right now, with around -19M flows for the past 30 days. That is not a good sign.


Stock name ^PSEI
Current Price 7581.79
YTD Return 9.06%
52Wk High 8118.44
52Wk Low 6084.28
MVWAP (10 days) 7729.95
MVWAP (20 days) 7831.33
MVWAP (65 days) 7861.16
MVWAP (252 days) 7287.11
YTD Flow 37,625,876.00
20D Ave Volume 9,115,808
50D Ave Volume 9,461,655
90D Ave Volume 9,299,764

Volume have been quite good so far for the index compared to last year, as most investors are in the defensive mode due to the increase of rates by FED. If you have an average of 9M volume per day, there is always a good trade in the Philippine Stock Market.

Figure 2: PSEi daily chart
In a range perspective, buy level is pegged at 7500, which is quite a strong support with a stop below 7343. But taking into account price action, you could see that it is mostly bearish, and that a buy signal will only be executed once 7500 support is held.

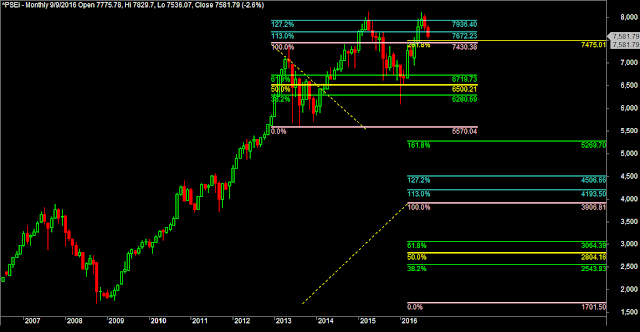
Figure 3: Monthly Chart
On a monthly chart, it does not look good also as you have two big red candles with you, but if you run fibonacci extensions to the chart, you will have psychological support around 7450 area.

WHAT'S THE BEST WAY TO DO RIGHT NOW?

For me, the best way you can do is to study more about technical analysis. There are a lots of books which are quite a good read for every investors, so take the opportunity to learn something. PSEi will not be in a "crash"mode (as per my vocabulary), but expect the market to be quite bearish. I would suggest you look for stocks (Non-Index, basura) which are quite not correlated with PSEi.

Be wise always. Study more. 

CAVEAT!

Disclaimer: Trading is a risky thing and the post in this site are for educational purposes only. Equities and Forex Trading is speculative in nature and may harm every trader and investor by losing money. Thus, do not treat this post as a recommendation to BUY or SELL a stock or a currency pair. Blog contents are valid only on the date of publication and will be subject to change without notice. Thus, the reader is advised to take precaution, and is recommended to do their own studies before pressing the BUY and SELL buttons. I will not take any responsibility with the readers trading results.

Stocks

More »

Forex

More »