
Now, as it is trading in a range for quite some time now, is it a good stock to buy? Let's see below.
 |
| Figure 1: EDC Weekly Chart |
| Stock name | EDC |
| Current Price | 5.8 |
| YTD Return | -6.45% |
| 52Wk High | 7.02 |
| 52Wk Low | 5.14 |
| MVWAP (10 days) | 5.8 |
| MVWAP (20 days) | 5.87 |
| MVWAP (65 days) | 5.73 |
| MVWAP (252 days) | 5.86 |
| YTD Flow | 292,386,784.00 |
| 20D Ave Volume | 13,995,765 |
| 50D Ave Volume | 15,476,720 |
| 90D Ave Volume | 15,270,214 |
In a monthly perspective, I am hoping EDC would stay above Php5.00, as it has been staying for quite a few months. Hope because, I dont want it to slide down as it would really be bad for the stock. So far, that support line is holding and that, I don't want to see this SHARK.
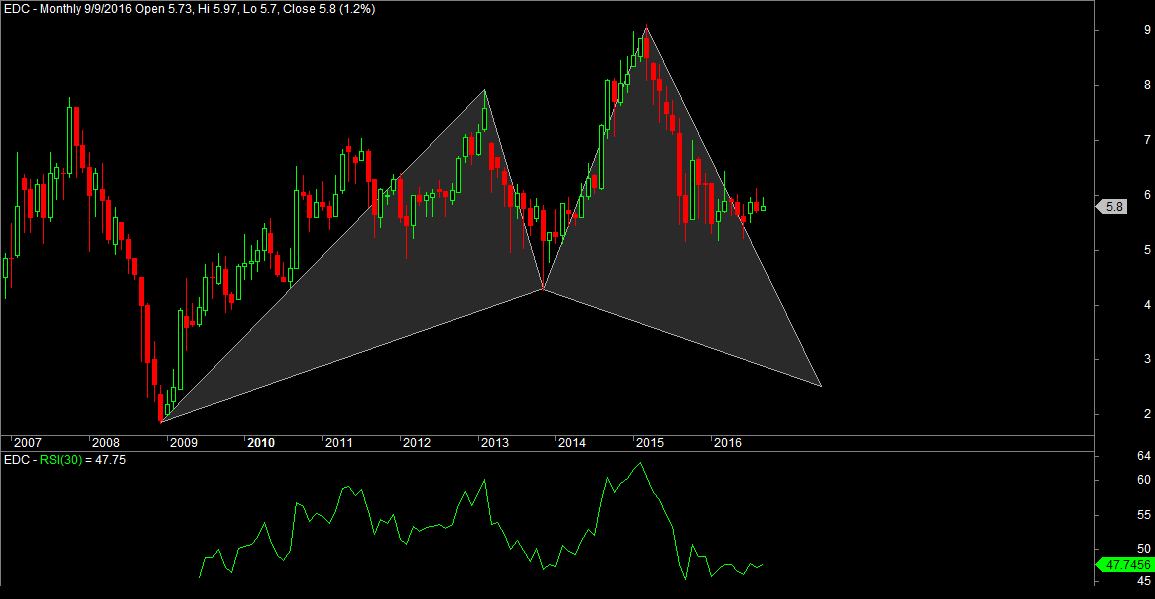 |
| Figure 2: Shark Pattern on the Monthly. |
Disclaimer: Trading is a risky thing and the post in this site are for educational purposes only. Equities and Forex Trading is speculative in nature and may harm every trader and investor by losing money. Thus, do not treat this post as a recommendation to BUY or SELL a stock or a currency pair. Blog contents are valid only on the date of publication and will be subject to change without notice. Thus, the reader is advised to take precaution, and is recommended to do their own studies before pressing the BUY and SELL buttons. I will not take any responsibility with the readers trading results.
EmoticonEmoticon