If you are a price action trader, one stock that you would disregards is $PXP. This stock has been battered and been sold out in the past months. But the question lies with, is $PXP now oversold?
 |
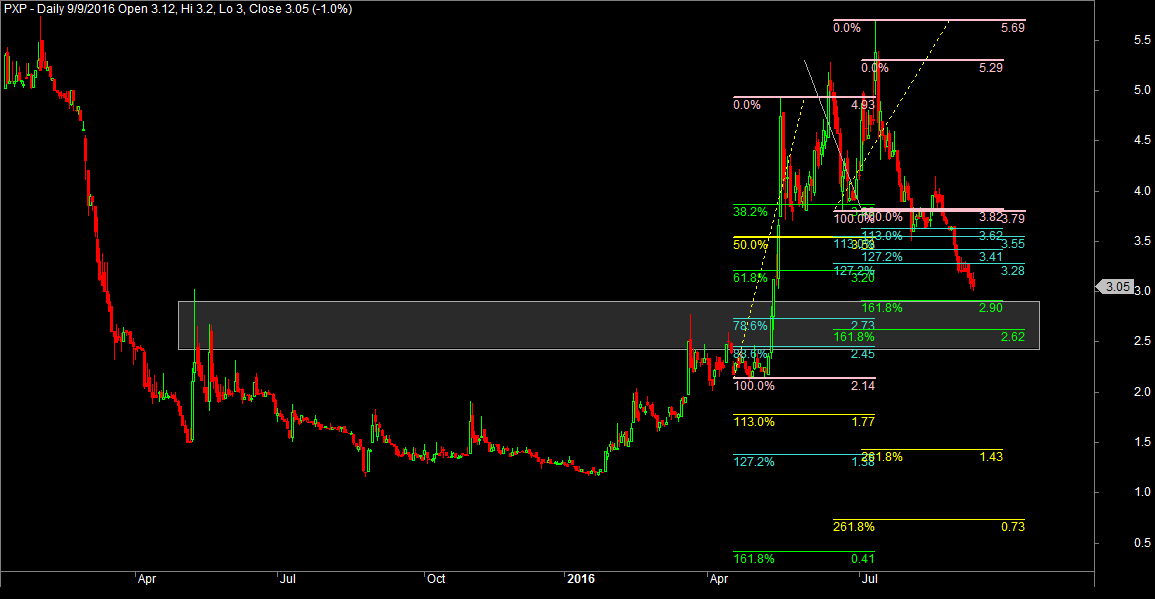
| Figure 1: PXP Daily Chart |
Looking at the chart, the range of Php3.125 and Php 2.34375 are my buy levels, that means that the stock my be oversold and would have a technical bounce soon. But if you look at current price action, I would wait some confirmation, or signs of reversal before I place my bet. Line in sad is Php2.34375.
 |
| Figure 2: Fibonacci Lines and Extensions |
Strong areas of support if you are using Fibonacci are on the range of Php2.45-Php2.90. Watchout for this stock as this might be tradeable again. Statistics are shown below for reference.
| Stock
name |
PXP |
| Current Price |
3.05 |
| YTD Return |
134.62% |
| 52Wk High |
5.7 |
| 52Wk Low |
1.16 |
| MVWAP (10
days) |
3.3 |
| MVWAP (20
days) |
3.6 |
| MVWAP (65
days) |
4.49 |
| MVWAP (252
days) |
3.42 |
| YTD Flow |
-49,147,424.00 |
| 20D Ave Volume |
2,941,650 |
| 50D Ave Volume |
7,154,372 |
| 90D Ave Volume |
7,640,495 |
CAVEAT!
Disclaimer:
Trading is a risky thing and the post in this site are for educational purposes only. Equities and
Forex Trading is speculative in nature and may harm every trader and
investor by losing money. Thus, do not treat this post as a
recommendation to BUY or SELL a stock or a currency pair. Blog contents
are valid only on the date of publication and will be subject to change
without notice. Thus, the reader is advised to take precaution, and is
recommended to do their own studies before pressing the BUY and SELL
buttons. I will not take any responsibility with the readers trading
results.


EmoticonEmoticon