Showing posts with label Stocks. Show all posts

Charts: FNI

FNI has been requested by one of the members in one group in Facebook for me to cover, so here's my brief analysis with regards to FNI.

FNI is still in a tight range for now, and considering the regulatory views of miners in the Philippines due to the strict implementation of DENR led by Gina Lopez, you should watchout carefully how the trade unfolds.

Figure 1: FNI Parameters
As far as my memory serves, this is one of the hyped stocks few years ago, were many investors are left crying with losses up to 100%. The key level to break for FNI is at 0.86 ~ 0.88 with big volume. Last Friday's close generated a volume buzz on my watchlist, and three (3) crossover signals which can be issued as a buy signal. Be cautious though as this is an exotic stock, and is mostly played in the market.

If you are a trend follower, please avoid this stock. For a momentum perspective, avoid this stock also. Watchout for volume buzzes so you can spot on potential returns on this stock.

Figure 2: FNI Ichimoku

Stock name FNI
Current Price 0.86
YTD Return 24.64%
52Wk High 1.34
52Wk Low 0.46
MVWAP (10 days) 0.84
MVWAP (20 days) 0.84
MVWAP (65 days) 0.86
MVWAP (252 days) 0.87
YTD Flow 583,543,360.00
20D Ave Volume 10,481,300
50D Ave Volume 17,232,140
90D Ave Volume 33,159,256

CAVEAT!

Disclaimer: Trading is a risky thing and the post in this site are for educational purposes only. Equities and Forex Trading is speculative in nature and may harm every trader and investor by losing money. Thus, do not treat this post as a recommendation to BUY or SELL a stock or a currency pair. Blog contents are valid only on the date of publication and will be subject to change without notice. Thus, the reader is advised to take precaution, and is recommended to do their own studies before pressing the BUY and SELL buttons. I will not take any responsibility with the readers trading results.

Charts: MEGanon?

Well, I have been trading $MEG before, though from my experience it is quite well correlated with the Philippine Composite Index, thus sometimes I tend to look at PSEi first, to see its support and resistance, before I look at highly correlated stocks like MEG.

Figure 1: MEG Yearly Chart
If we look at the yearly chart of MEG, it is a buy on dips, with immediate line in sand at Php4.25, or the year should close above Php4.25 in order to have a shot at trading high next year.


Figure 2: Spyfrat Chart
Looking at RSI (30), there's a current resistance shown in Figure 2, with a  resistance also of 50SMA, so if you think it will stop for a while on those resistances, calculate risk reward before opting to trade the stock.

Figure 3: Support and Resistances
Looking at the parameters, if you want to trade the stock come Monday, line in sand at Php4.49 with the expectation that it would break above Php5.5, as I see that the stock is bullish at this point with a series of structure highs. This would I think give you a better risk reward.


Stock name MEG
Current Price 4.79
YTD Return 12.71%
52Wk High 5.51
52Wk Low 3
MVWAP (10 days) 4.62
MVWAP (20 days) 4.7
MVWAP (65 days) 4.87
MVWAP (252 days) 4.28
YTD Flow -717,022,336.00
20D Ave Volume 45,948,048
50D Ave Volume 43,508,164
90D Ave Volume 45,909,256

CAVEAT!

Disclaimer: Trading is a risky thing and the post in this site are for educational purposes only. Equities and Forex Trading is speculative in nature and may harm every trader and investor by losing money. Thus, do not treat this post as a recommendation to BUY or SELL a stock or a currency pair. Blog contents are valid only on the date of publication and will be subject to change without notice. Thus, the reader is advised to take precaution, and is recommended to do their own studies before pressing the BUY and SELL buttons. I will not take any responsibility with the readers trading results.

Charts: SPX500 Warning!

Many investors in the Philippines correlates indices from other countries, and one index that investors watch for sentiment is the SPX500. SPX500 is S&P 500 Index of US listed shares.

I have been quite cautious and have watched how this index would unfold, since I am thinking that momentum has slowed down.

Figure 1: SPX500 Chart
Though it broke above 2,100++ levels, and currently held it, if momentum doesn't build up, this is going to be quite bearish. Though FED has not raised interest rates this September, I am still observing this as I think this could be the last leg up for SPX500. Fibonacci Extensions are shown below for price projection and target. Watchout for 2300-2400 levels.

Figure 2: Fib Extensions


CAVEAT!

Disclaimer: Trading is a risky thing and the post in this site are for educational purposes only. Equities and Forex Trading is speculative in nature and may harm every trader and investor by losing money. Thus, do not treat this post as a recommendation to BUY or SELL a stock or a currency pair. Blog contents are valid only on the date of publication and will be subject to change without notice. Thus, the reader is advised to take precaution, and is recommended to do their own studies before pressing the BUY and SELL buttons. I will not take any responsibility with the readers trading results.

Charts: FLI high!

$FLI (Filinvest Land, Inc) is one of my favorite stocks in PSE, though as of the moment, I have no shares with FLI. I missed the buy level last September 9, 2016, which would have produced me close to 10% by now.

Figure 1: FLI Levels
FLI needs to punch through midpoint at Php1.95 to avoid a potential lower high, which as you know is a bearish indication which would mean that momentum has slowed down. Buy levels at Php1.81 - Php1.86, though you can buy on the levels posted, just make sure to calculate risk vs reward ratio before buying. A risk reward ratio of 3 is pretty good enough.

Figure 2: Bearish Butterfly on the Monthly
On harmonics perspective, I am looking at this potential butterfly setup on the monthly chart, with target prices as shown on the image. I will be bearish with the stock if it breaks below Php1.80.

On a side note, those who have been using Jared's SWAG and Mark Anthony's crossover system, they have issued a BUY signal. Volume is quite good also with statistics as shown below.

Stock name FLI
Current Price 1.91
YTD Return 5.52%
52Wk High 2.08
52Wk Low 1.32
MVWAP (10 days) 1.86
MVWAP (20 days) 1.88
MVWAP (65 days) 1.94
MVWAP (252 days) 1.79
YTD Flow -139,602,848.00
20D Ave Volume 10,836,850
50D Ave Volume 18,999,220
90D Ave Volume 18,576,678

CAVEAT!

Disclaimer: Trading is a risky thing and the post in this site are for educational purposes only. Equities and Forex Trading is speculative in nature and may harm every trader and investor by losing money. Thus, do not treat this post as a recommendation to BUY or SELL a stock or a currency pair. Blog contents are valid only on the date of publication and will be subject to change without notice. Thus, the reader is advised to take precaution, and is recommended to do their own studies before pressing the BUY and SELL buttons. I will not take any responsibility with the readers trading results.

Charts: CHIB

$CHIB has been one of the low volatility stocks that you would want to have (10 day Volatility at 4.08%) though it has only been up 1.88% year-to-date. But here's some brief analysis with the stock.

Figure 1: CHIB
$CHIB is currently below 50SMA, but I found an RSI support at 45 level. This may provide a little bit of a bounce.

Figure 2: Foreign Flows
In Foreign flow perspective, it has a net inflow of around Php58M, which is pretty good compared to other stocks. But take note that CHIB is in a narrow range as of the moment, so it needs to take out Php39.5 definitively in order to widen its range.

Figure 3: Range Parameters for CHIB
If I would have to trade it, I would buy it at market price tomorrow (Php37.9) with a stop at Php37.1 and target above Php39.5. That would give me a decent Risk Reward Ratio of 2. Though multiple MVWAP resistance are waiting at around Php38 level.

Statistics are shown below:


Stock name CHIB
Current Price 37.9
YTD Return 1.88%
52Wk High 43
52Wk Low 33.5
MVWAP (10 days) 38.06
MVWAP (20 days) 38.12
MVWAP (65 days) 38.11
MVWAP (252 days) 38.44
YTD Flow 57,823,264.00
20D Ave Volume 83,000
50D Ave Volume 101,066
90D Ave Volume 96,414

CAVEAT!

Disclaimer: Trading is a risky thing and the post in this site are for educational purposes only. Equities and Forex Trading is speculative in nature and may harm every trader and investor by losing money. Thus, do not treat this post as a recommendation to BUY or SELL a stock or a currency pair. Blog contents are valid only on the date of publication and will be subject to change without notice. Thus, the reader is advised to take precaution, and is recommended to do their own studies before pressing the BUY and SELL buttons. I will not take any responsibility with the readers trading results.

Charts: DNL - The hottest stock, before.

One of the filters I used when screening stocks is the SWAG system by Jared Odulio. This has been proven to provide gains to traders, though for me I think it will not stand the test of time if its a stand alone system. As usual, I pair it with my range parameters and other systems to provide me with high probability trades.

Figure 1: DNL Swag
When I was scanning my filters, this stock came out and I had to look at the charts if I could enter on this one. Last Friday's close had the 13EMA (Exponential Moving Average) crossed the 20SMA (Simple Moving Average).

Figure 2: DNL Parameters
Current parameters is showing that it is on the top end of my range, which I think needs close monitoring. If one would be long on this stock, put a stop around Php11.40 with a target measured move of around Php16.40.

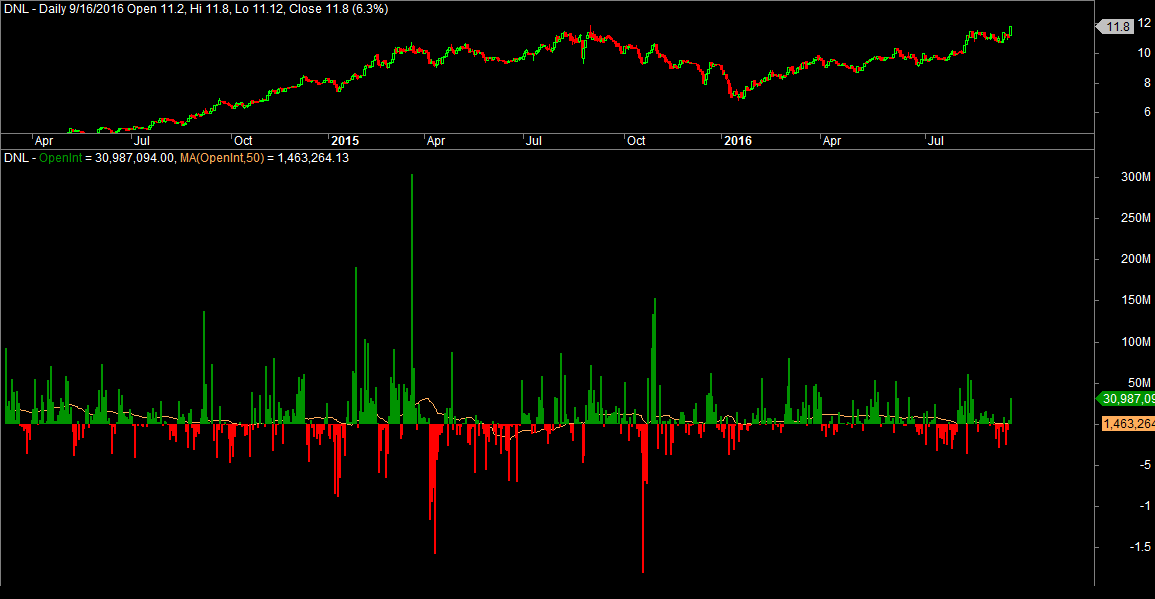
Figure 3: Foreign flows
Statistics are shown below:


Stock name DNL
Current Price 11.8
YTD Return 28.96%
52Wk High 11.8
52Wk Low 6.77
MVWAP (10 days) 11.18
MVWAP (20 days) 11.17
MVWAP (65 days) 10.48
MVWAP (252 days) 9.39
YTD Flow 928,395,840.00
20D Ave Volume 5,489,975
50D Ave Volume 6,079,750
90D Ave Volume 5,209,438

CAVEAT!

Disclaimer: Trading is a risky thing and the post in this site are for educational purposes only. Equities and Forex Trading is speculative in nature and may harm every trader and investor by losing money. Thus, do not treat this post as a recommendation to BUY or SELL a stock or a currency pair. Blog contents are valid only on the date of publication and will be subject to change without notice. Thus, the reader is advised to take precaution, and is recommended to do their own studies before pressing the BUY and SELL buttons. I will not take any responsibility with the readers trading results.


Stocks

More »

Forex

More »